


Instacart S-1 Analysis Part I
A first look at $CART's S-1 disclosures. Some discussion on Unit Economics, Retailer Fees, and Cohorts

Instacart finally filed for an IPO last Friday under the ticker $CART revealing $29.4B of GTV and $2.9B of revenues for the twelve months ended June 30, 2023 along with 5 consecutive quarters of profitability on a GAAP net income basis (albeit, not fully incorporating the impact of SBC once it goes public). Nearly two years since the peak of the NASDAQ Composite and the craziness of IPOs in 2021, it’s unclear whether the market is ready to welcome venture-backed technology issuances. But combining a category leader in a massive and under-penetrated TAM with expanding margins and net income profitability, Instacart will likely be one of the most high-profile IPOs of the year. This post is part 1 of my analysis and will focus on digging through some of the S-1 disclosures, primarily around KPIs and revenues. We’ll save the projections, cost analysis, and evaluation of the stock offering to a later part. I’m going to assume the reader has at least skimmed the S-1 so I’ll present mostly my analysis and try my best not to just summarize the document, except for maybe part of the overview.
All the analysis here is my own work and any miscalculation or misinterpretation of CART’s S-1 are my own. If you find any mistakes or disagree with my assumptions or conclusions, feel free to let me know and I’ll decide whether or not to edit the post.
Overview
For those unfamiliar with the company, Instacart is a digital-first grocery delivery business, engaging gig workers (called “Shoppers”) to go to the grocery store and pick out the items a customer requests over its app or website.
Instacart describes itself as a “grocery technology company”. This isn’t really a buzzword-y slogan like Uber’s mission to “ignite opportunity by setting the world in motion”; it’s actually pretty down to earth and emphasizes its focus on creating technology to help grocery retailers and CPG brands sell more goods whether it’s through Instacart’s Marketplace, its white-listed Enterprise Platform, or its advertising offerings. It’s also reflected in the way the app is designed - it’s not an AMZN-like marketplace where you can price-compare the same or similar products or find cheaper private-label brands to compete against brick & mortar offerings. It has positioned itself as an advocate to the grocery retailer industry, which has historically under-invested in digital, by providing the technology platform they need to compete against digitally native marketplaces.
The numbers, at a glance…
The US Grocery market is ~1.1tn in 2022 and grows ~LSD. COVID provided a big bump (~12% growth in 2020) while 2021/2022 saw small declines as the economy reopened.
Within groceries, the online penetration stands currently at ~12%, growing from LSD in 2018/2019. Similarly to the broader grocery market, COVID provided a big bump in online penetration but this stuck, accelerating the pace of overall online adoption.
Instacart stands at ~21% market share of total online grocery ecommerce, having grown market share from the low teens pre-COVID and peaking in 2021 at 23%.
GTV grew at a mid-80% rate in 2018 and 2019 and then massively accelerated by COVID to >300% before steadying out at 20%/16% in 2021/2022. Interestingly GTV growth CAGR-ed at 80% from 2018-2022, consistent with pre-COVID growth.
GTV was driven primarily by orders growth while GTV per order is mostly steady during this time, seeing a bump during COVID but reverting back to ~$110 per order.
Transaction revenue take rate of 5%-6% of GTV, rising to ~7% in 1H23 while Advertising and Other revenue stand at ~3% of GTV in 1H23.

Unit Economics
The S-1 provided this chart below…
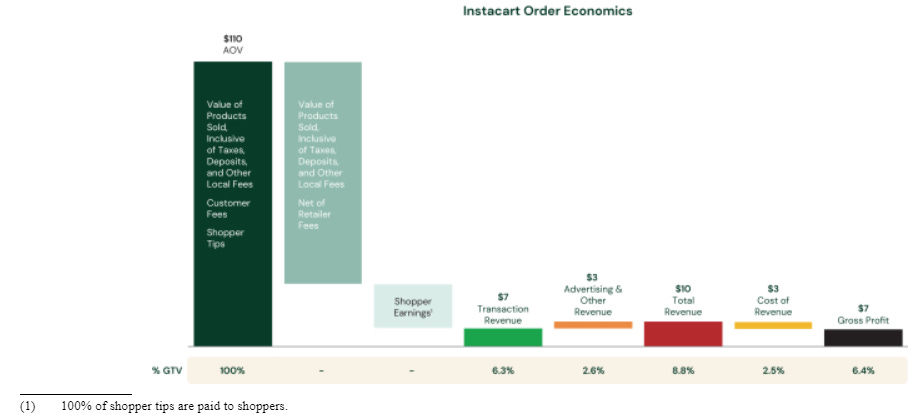
…which is helpful, but I’ve made another version of it based on the in-depth definitions provided in the S-1. I prefer this version as it gets a bit deeper into what exactly is in each category as well as who (CART, retailer, shopper) gets what in each transaction. I’ve also included my estimates for the breakdown for 1H23 based on some of my own assumptions and experience with the app.

GTV includes the whole list of items in the table except for the customer incentives, coupons, and refunds, which is a contra-revenue item for CART.
Retailer fee + Customer fees was 14.9% in 2022 and I estimate it to be ~15.5% in 1H23. As the term suggests, this is a combination of the fees charged to customers (delivery fee, service fee, other fees, and the Instacart+ membership fee) along with the fee charged to retailers.
Transaction revenues = (Retailer fees + Customer fees) - (Shopper Earnings) - (Incentives, coupons, refunds).
I know…it’s not unit economics until it’s on a per unit basis so here is the same table with the numbers on a per order basis instead of the total estimate.

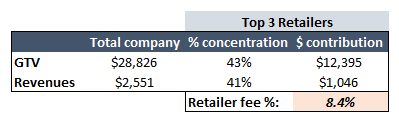
You’ll notice that I’ve highlighted the Customer delivery fee, the Customer service and other fee, and the Retailer fee section with a bolded outline. I think this is important to dig deeper into as this is effectively CART’s pricing power. In particular, I’m mostly interested in the Retailer fee component of this because the top four customers account for ~53% of 2022 revenues while the top three retailers account for ~43% of GTV.

Based on the disclosure of GTV concentration and revenue concentration of the top 3 retailers, we arrive at an implied ~8.4% retailer fee in 2022.
It’s not perfect because there could be other considerations that impact the actual take rate. Also, non-top 3 clients may have a different retailer fee; usually I would assume the smaller customers have a higher take-rate because there is less negotiating leverage but in this case, I think the smaller customers like regional supermarkets or local pharmacies, etc might actually have a lower rate as some might be earlier in their partnership with CART and benefiting from a trial/ramp up period or perhaps the value-add just isn’t as high on a sub-scale basis. It’s also possible that some of the revenues contributed by the top 3 retailers are captured in Advertising and other, although I think that’s mostly from the CPG brands. Either way, I think the company average Retailer fee is probably closer to my estimated 7.8% of GTV (see earlier table’s % of order value column) than the implied 8.4% here.
With its top 4 retailers accounting for more than half of its revenues, CART faces a high level of concentration risk. What happens if one of these retail partner chooses to go with a competitive delivery service or build their own? It’s possible but naturally there is a high switching cost for retailers and the industry has been underinvested in and as long as the cost of being on CART is lower than the cost of building their own delivery system, I don’t see the retailers shifting off. Leaving aside the risk that a retailer leaves the platform for a moment, the more moderate risk (and more likely one) is if one or more of the retailers begin to pressure CART’s Retailer fees down.
So if CART is charging roughly 7%-8% of GTV from it’s retailers. Let’s see what this means for the unit economics of a grocery retailer. Using Kroger as an example, we see that a grocer at scale does LSD EBIT margins while incremental margins (i.e. profits on an incremental basket sold) is ~10% but this can fluctuate meaningfully year to year.

Now let’s compare the economics of an incremental order at the retailer vs through CART with and without an additional markup on prices.

It’s clear that without a markup, the incremental profit to the grocer is meaningfully lower through CART than not on CART with ~$3 contribution vs the $10 they get in-store. However, when the retailer applies a markup to the goods sold on CART, it’s possible to get the incremental profit to be better than in-store. Of course, you’d expect the retailer to pay up to get incremental volume. But I’m not sure Instacart is really growing the TAM of groceries as a whole so that incremental volume gained is coming from a competing grocer, meaning that on a system-wide level, we shouldn’t really expect grocery retailers to pay up for incremental volume. I suppose at 12% online penetration, we’re not quite at the level where the retailers are acting on a system-wide level thinking yet so paying up in the medium term makes sense to capture greater sales. There is also the consideration that the Retailer fee doesn’t always eat into the retailer’s unit economics such as when the fee is recognized as the difference in price between amounts charged to the user and the actual settlement price paid to the retailer.
This is obviously illustrative and there are plenty of moving parts we’re not considering specific to each negotiated partnership but on the whole, I’m actually not 100% sure what to make of this. If you’re skeptical, you’d say that 2.6% incremental margins is too low for a retailer (especially if you think Instacart is also taking away slotting fees that the retailers would have received from CPG brands through its advertising platform) and that retailers will push back, maybe all the way to at least half of the in-store margin, which would push Retailer fees to ~5%, a full 280bps hit to revenue take rates. On the other hand, if you see opportunity in this table, you’re probably looking at that 11.8% incremental margin on just a small 10% markup. Consumers will complain about pricing but from the examples of UBER and DASH, we know people are willing to pay extra for the convenience of delivery so there’s room to push out more markups (or the economic equivalent when it comes to the CART/retailer partnership negotiations) and raise the Retailer fee for CART while still having the retailer make the same or more incremental profits as an in-store transaction. All this is to say I’d be asking management about the nuances of that Retailer fee and how they think about that going forward. If I were a scuttlebutt kind of investor, I’d be talking to the grocery retailers about this fee and what flexibility they have with it. I think the sustainability of this fee is important to understanding the LT unit economics of Instacart’s business
Instacart+ Members and Monthly Active Orderers
Instacart+ membership creates a subscription + consumption revenue stream for CART. At a price of $9.99/month or $99/annually, a customer will get benefits such as unlimited free delivery for orders above a certain size, a reduced service fee, credit back on some pickup orders, etc.
CART noted that as of June 30, 2023, it had 7.7m monthly active orderers and 5.1m Instacart+ members. This implies 2.6m non-members. They then noted on page 109 of the S-1 that,
On average, an Instacart+ member spends an aggregate of $461 over 4.0 orders per month, compared to an aggregate of $223 spent over 2.0 orders by a non-member.
This really took me for a loop and I had a lot of trouble reconciling these numbers because my mental model went as follows: Okay, so 7.7m active orderers at the end of 1H23, so maybe call it 7.2m on average during 1H. On average probably ~5m Instacart+ members in 1H doing $461/month in GTV each and on average probably ~2.2m non-members doing $223/month in GTV each. This gets to $22.9b in GTV for 1H vs the actual $14.9B, a pretty significant difference that doesn’t get explained by estimation error on the average across the period vs period-end. For those of you who saw the issue in my math right away, you’ll have to forgive me because I spent way too long trying to reconcile these numbers. The issue is of course the 2.6m non-members aren’t members who spent $223/month in each month; it’s 2.6m non-members who transacted at least once in the month of June, 2023. Namely, these aren’t “recurring” customers so we can’t treat them as such.
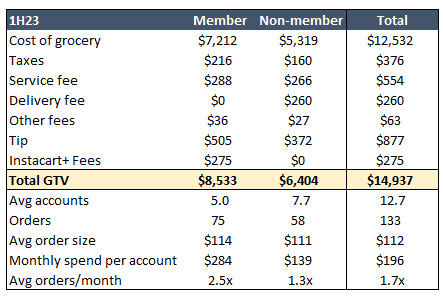
I tried slicing the data in a number of different ways to get to a number that included all accounts that transacted during the period and made quite a few assumptions so I’ll skip the walk-through here and go straight to the results. If you’re interested in the assumption walk-through (for this or any of the analysis), email me and I’ll send it over. My sense is that the Instacart+ members on average has 2.5x transacting orders per month with an avg spend of ~$114 per transaction while non-members spend ~1.3x per month and spend ~$111 per transaction. I also think that the total unique transacting account number is closer to 12.7m in 1H23 than the monthly active orderer number of 7.7m. See below for the table summarizing the stats along with the breakdown of GTV and its components by Instacart+ and non-member accounts.
My qualms about the monthly active orderer metric is that you’ll end up with people saying that 66% (5.1m/7.7m) of Instacart’s accounts are on the Instacart+ subscription, which is just not true. Similar to my qualms with the numbers presented this way, the chart below showing the cohort improvement in average orders and GTV suffers from the same issue.

The footnote to this chat to this chart states:
For each year, the average figure represents average monthly orders or average monthly GTV, as applicable, per monthly active orderer for the applicable cohorts, weighted by the size of each cohort on the basis of monthly active orderers. For example, “Year 1” reflects the first year of results for the 2017 through 2022 customer cohorts while “Year 4” reflects the results for only the 2017, 2018, and 2019 customer cohorts. Average monthly GTV or orders, as applicable, per monthly active orderer for each cohort in a given year is calculated by determining GTV or total orders, as applicable, per monthly active orderer for each calendar month and averaging each monthly GTV or total orders, as applicable, per monthly active orderer, weighted on the basis of the monthly active orderers for each month. For the purposes of these charts, a monthly active orderer is a customer who places at least one order on Instacart in any particular month in that customer’s year of activation. Each monthly active orderer belongs to the annual cohort in which that customer made an initial order.
The part I bolded is basically saying they calculate the average GTV or orders for a month by including only those who actually transacted and then averaging that number across months so those who did not transact do not contribute negatively to this average.
I’m not saying the chart is misleading, now that I know how it’s calculated I can see that there is a positive trend in both average monthly orders and GTV but I’d also like to see what the behavior of the average account was and not just monthly active orderer. But I get it, it’s an IPO prospectus so they want to put their best foot forward and they’ve given a lot of disclosures already so we can’t be too greedy here.
I’ll stop here on this analysis because ultimately an investor or researcher would be better of using 3rd party data (Yipit, Earnest, etc) to map out the account behaviors over time.
Cohorts
Page 106 of the S-1 nicely lays out the annual GTV by cohort. Unlike the prior chart on just monthly active orderers, this chart is about all accounts of a particular cohort. Namely that a >1.00x in the table means that the annual GTV from customers retained more than offset the GTV lost from customers who did not further transact.


Alas, if only they gave us the exact dollar amounts. But fear not, for I have busted out a digital ruler and measured the pixel lengths of each stack. Here are my estimates:

Some takeaways
COVID clearly drove a lift in GTV growth for each cohort. What’s impressive though is that all the cohorts held on to the growth post COVID and continued to grow.
The 2020 cohort is showing GTV declines in 2021 and 2022 but not entirely unexpected because many who were forced to order groceries online for delivery are now back to shopping in person. It’s actually impressive that not more from that cohort has churned off. My estimates show that the 2020 cohort is roughly a $552m/$1,103m or (-3%)/(-4%) headwind to 2021/2022 GTV growth.
Instacart calls out continuing macroeconomic uncertainty, the cessation of gov’t stimulus, and initiatives to drive profitable growth as reasons for near term GTV growth to be tempered across existing and new customer cohorts.
We see that all cohorts are exhibiting YoY declines in GTV in 1H23, with the more recent cohorts seeing greater drop offs. Probably some version of the LIFO effect of non-essential spend (i.e. the last luxury is the first to go when times are hard).
I think this is going to be tricky for CART because bears will say near-term cohorts exhibit worst transaction behavior, perhaps as a result of TAM saturation (not everyone will be willing to pay up for grocery delivery, and maybe that group is much smaller than expected, and maybe CART is hitting up on that penetration already). Bulls might say that this is just the result of the economic downturn but bears will say that both recent and previous cohorts are facing the same economic reality so the difference is just the type of customer in the cohort. Ultimately until we get through to the other side of this downturn in the economic cycle, it’ll be hard to make the case that cohort quality isn’t declining.
Other stuff
Instacart uses MQ to issue cards for its shoppers and generate a rev-share with them. We knew this from the MQ IPO a few years ago but interesting to see some of the details around the arrangement.
I saw some people tweeting and freaking out over a disclosure that payments to SNOW fell from $51m in 2022 to ~$15m in 2023 and pointing to the effects of vendor migration or optimization. I think someone else might have pointed out that it was referring to cash payments so actual usage isn’t off a whole lot.
We didn’t talk much about advertising revenues which is 1/3 of total revenues. I’ll probably dedicate that to another post but overall not too surprising here. This is effectively taking share from slotting fees paid by CPG brands to grocery retailers. It looks like this might account for nearly all the profitability but I don’t think that’s as negative as it sounds. Grocery retailers are so low margin (1-3%) that some of them make more money off the slotting fees than the actual sale of the product, it’s just how the industry works. I’ll note that this rate is consistent with Uber’s disclosure of Cornerstone having ~2-3% of GBV in advertising revenues.
Near-term expectations as mentioned in the S-1:
Gross margin: “We expect the pace of gross profit expansion to taper in the future. Recent trends were driven in large part by the benefits of optimization of customer fees and realization of fulfillment efficiencies that increased transaction revenue, which benefits are expected to decelerate in the future, as well as the increase in advertising and other revenue from increased advertising volume…However, for the reasons set forth above, we believe that we can continue growing our average monthly gross profit per monthly active orderer across all of our cohorts over time.”
Advertising take rate: “As we grow sales for emerging brands and these categories, we expect to experience a mix shift towards GTV with higher advertising and other investment rate.”
Cohort KPIs: “over the near term, we expect engagement trends and GTV growth for our customer cohorts to be tempered”
GPV: “GTV from the 2020 cohort declined sequentially in 2021 and 2022 because certain health factors became less important to our customers. Over the near term, we expect this trend to continue for our more recent historical cohorts, including our 2021 and 2022 cohorts. We also expect GTV growth to be tempered across our existing and new customer cohorts over the near term.”