


Outdoor Advertisers
Ramping on Media and Telecom Part III

"I think that I shall never see a billboard lovely as a tree. Perhaps, unless the billboards fall, I'll never see a tree at all." - Ogden Nash
This is the third part of my Ramping on Media and Telecom series, where I learn about different sub-sectors of media and telecom and write about them. Check out my introductory post on why I started this series as well as my first article on Local TV Broadcasters and my second article on Cable Operators. For this piece, I’m taking myself out of my NYC apartment and onto the streets to explore the outdoor advertisers. The sector is also known as out-of-home (“OOH”) advertising and broadly covers advertising that reaches its audience outside of their home environments, typically referring to advertisements placed on physical structures like billboards, posters, bus shelters, and more.
Total advertising spend in the U.S. has grown at a roughly 4% CAGR over the last two decades hitting ~$337B in 2023.1 The category breakdown during that time is exactly what you would have expected: traditional advertising channels like linear TV, print, and radio lost market share, while digital (including social, search, and CTV) have gained market share. But would you have guessed that the out-of-home category has consistently been ~3-4% of the U.S. market during these two decades? I certainly would not have expected that. In fact, it’s the only traditional media format to have roughly kept pace with the broader advertising industry growth. Globally, the OOH spend is slightly higher than the U.S., standing at ~6-7% but it has also maintained its market share over the decades.2 The industry touts OOH’s ability to reach audiences in places that other forms of media can’t reach; if you’re driving down the freeway or walking through Times Square you really can’t miss these billboards. There are no ad-blocks on the highway. Additionally, this format doesn’t compete for audience attention with the content being consumed such as the case with TV advertising. Even tech-savvy startups have embraced the outdoor format — Brex, the corporate card and cash management startup valued at over $12B in the private markets, famously had great success with OOH advertising after seeing disappointing conversions through digital marketing. Since Brex was offering a product for other startups, they plastered billboards, bus stops, and posters across San Francisco where they estimate 40% of their potential customers reside.
“The cost per qualified view of a billboard is so much lower than the cost per qualified view on any online display platform” - Henrique Dubugras, founder/CEO of Brex
Brex loved outdoor advertising so much that one of the perks offered to its startup clients through their corporate credit card is using Brex points to purchase billboard advertising:

The industry at a glance…
The Out of Home Advertising Association of America (“OAAA”) estimates total industry CY23 revenue of ~$8.7B, amounting to a bit under 3% share of total ad spend in the U.S.
The big three publicly traded OOH players are Lamar Advertising (LAMR), Outfront Media (OUT), and Clear Channel Outdoors (CCO). Together they made up ~60% of total industry revenues.
These top three players together manage nearly 250k billboards in the U.S. not including transit and CCO’s airport division.
As with any advertising business, revenues are pro-cyclical. The main growth driver in the industry is a transition from static billboard to digital billboards, which are higher revenue per structure and cost less to maintain.
Industry History and Overview
Pinpointing the exact origins of outdoor advertising is a bit of a silly exercise given how ubiquitous this medium of communication has been throughout history. Ancient commercial messages on painted walls have been found throughout Europe, Asia, Africa, and the Americas dating back thousands of years. Archeologists have discovered political campaign displays in the ruins of Pompeii. The ancient Romans and Greeks were also known to have used signage for shop fronts as well as to announce public events. Even the OAAA’s website on the History of OOH starts off with the ancient Egyptians employing stone obelisks to publicize laws and treaties.3 While I don’t think it is particularly alpha-generative for investors to study ancient advertising techniques, it’s notable that the core function of this format to reach its audience has remained the same through the times.
Modern OOH advertising focuses around billboards/posters and not obelisks (honestly, that’s our loss) so we should start in 1796 with the invention of lithography, a process of printing where an image is covered with ink on a treated limestone plate and transferred to wherever it was to be printed. The process is based on the principle that oil-based ink and water don’t mix and therefore separate nicely (that’s what results in the printing) and was invented by the German author and actor Alois Senefelder who used this technique to print musical scores and maps. Modern billboard printing relies on a similar but improved process called offset printing whereby each color is first transferred from the stone plate to a rubber blanket and then finally to the vinyl, which is the most commonly used material for billboards since it is water and UV resistant, allowing it to withstand the rough outdoor environment. Once the ink is dried, the vinyl is laminated and adhesives are applied to the back of the board, readying it for mounting.4
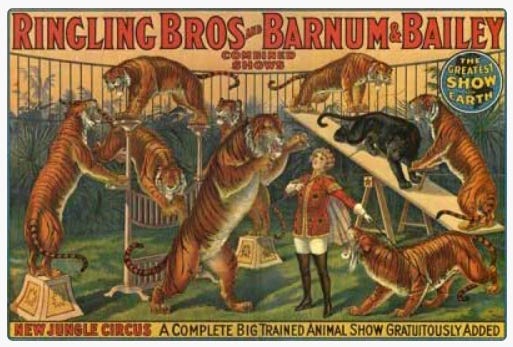
The industry we now call outdoor advertising really began in the 1830s as merchants in the U.S. began putting up painted signs on roadsides to advertise their local offerings. Famously, one of the first major large-scale billboards was erected by Jared Bell in 1835 to advertise the Ringling Brothers-Barnum & Bailey Circus. The magnificent poster was more than 50 sq ft in size and featured the circus’s performing animals. It was another 15 years or so before we began to see the exterior of street railways being used for advertising as well. The first recorded leasing of billboard for advertising occurred in 1867 and by 1870 there were nearly 300 sign-painting and bill-posting companies operating in the country.
In the early 1900s, a standardized billboard format was established nation-wide that allowed advertisers to plan and execute national campaigns. National advertising showcased OOH’s cultural impact with examples like Coca-Cola’s holiday billboard strategy in the 1930s, portraying the jolly Santa Claus figure dressed in red from head to toe that we all know today. Apparently before this, Santa was portrayed in all sorts of ways from being a lanky old man to a gnome-like figure with sharp teeth (yikes).5 The 1940s saw billboards used to rally support for U.S. troops fighting WWII.
In 1952, President Eisenhower signed the Federal-Aid Highway Act into law, authorizing $25B for the construction of tens of thousands of miles of interstate highway over a 10 year period. It profoundly impacted American society as it fundamentally tilted the United States towards a nation based on the automobile as its main mode of transportation. Probably unintentionally, this was also a profound event in the history of the OOH industry as these new roads created prime real estate for billboard advertising. But not everyone was pleased by the proliferation of posters and billboards across the country. In the early 20th century, women sought to become more involved in American society than in previous generations, leading to the formation of Women’s Clubs, which targeted a range of issues at both the national and local level. One such group was the National Roadside Council, which was formed by housewife Elizabeth Lawton in the 1920s to combat the “roadside blight”, referring to the various billboards popping up along the national highway system. The group grew to a number of state and regional councils composed primarily of woman who lobbied against the outdoor advertising industry.6 In the 1960s, First Lady “Lady Bird” Johnson took up this cause and heavily lobbied congress to enhance the beauty of America’s interstate road system. These efforts culminated in the 1965 Highway Beautification Act which, due to her efforts, is also commonly referred to as “Lady Bird’s Law”. The Act establishes a framework for states to regulate outdoor advertising on highways built with federal financial assistance. Readers of this Substack have suggested to me that my sections on the industry background are too long and mostly pretty boring; I guess people want to get right into the financials. But this part is important: the Highway Beautification Act largely prevents new highway billboards from being constructed, thus creating a very high barrier to entry for the U.S. highway advertising industry. Many of billboard structures operated by the large OOH players are “legal nonconforming” meaning that they are grandfathered into their locations since the structures were legally constructed at the time they were built and remain legal to operate but newer structures cannot be built in the same area, which enhances the value of the OOH advertisers’ portfolio. In its 10-K, OUT notes that “approximately 75% of our billboard structures in the U.S. are ‘legal nonconforming’ billboards” and I would imagine this is similar for the others as well.
Many of today’s leading OOH advertisers first sprung onto the scene in the early 20th century. In 1901, Walter Foster and George Kleiser founded Foster & Kleiser Outdoor Advertising in the Northwest. The duo was credited as having been pioneers in the industry, expanding beyond simple posters to uniformed structures with professional grade illustrations. The company initially targeted Portland, OR and Seattle, WA before expanding aggressively along the west coast, acquiring smaller firms along the way. The company was sold to W.R. Grace and Company in 1952 before being acquired by Metromedia in 1959 (when Metromedia was a division of Metropolitan Broadcasting). The company was then sold to Patrick Media Company and changed its name to Patrick Media Group in 1986. In 1995, the assets were acquired by Karl Eller and Partners, which came with another name change to Eller Media Company. Ownership then changed hands again in 1997 when Clear Channel Communications acquired it and merged it with Universal Outdoor (which itself has a storied history spanning even more regional acquisitions), bringing its total footprint to a whopping 88,000 display. Clear Channel Communications then acquired The More Group in 1998, expanding its OOH footprint into 25 countries and 33 states. By the early 2000s Clear Channel Communications had levered up to acquire its way into a media conglomerate owning radio stations, ticketing vendors, and more. In November 2005 the outdoor advertising subsidiary (Clear Channel Holdings, Inc.) went public at $18/share. In 2008 Clear Channel Communications was taken private by Bain Capital and Thomas H. Lee Partners, two years after the initial announcement due to lengthy legal battles and negotiations to lower the purchase price amid the financial crisis. I’ll skip the rest of the Clear Channel Communications drama other than that it changed its name to iHeartMedia in 2014 before declaring bankruptcy in 2018. Through the bankruptcy process, Clear Channel Outdoor (the OOH business) was spun out entirely, becoming an independent company but burdened with a heavy debt load. Over the last few years, the company has been on a path of shedding its international assets and turning its U.S. business into a REIT, just like its peers.
Outfront Media (OUT) traces its origins to multiple OOH advertisers. The transit advertising business developed as Transportation Display Incorporated (“TDI”) which began in 1938 and focused on commuter advertising at railroad terminals and timetables. The company was sold to International Telephone & Telegraph (“ITT”) in the 1970s under ITT CEO Harold Geneen’s acquisition spree as the company became the archetypical conglomerate of the era.7 TDI ownership switched to the Winston Network in the early 1980s before landing at Infinity Broadcasting in 1996. OUT’s billboard business was originally National Advertising Company (a division of 3M) and Gannett Outdoor (owned by the Gannet Company). By the mid-1990s, both companies were acquired by Outdoor Systems Advertising (“OSI”). OSI would go on to be acquired by Infinity in 1999, which itself had merged with CBS Corporation by then. In 2000, CBS and Viacom merged and in 2001, the transit business and the billboard business were put together into one entity named Viacom Outdoor, which then became CBS Outdoor in 2005 when CBS and Viacom split up. CBS eventually spun out the OOH business in 2014 when it started trading under the ticker CBSO. That same year CBSO became a REIT and underwent a rebranding to Outfront Media, changing its ticker to OUT along the way.
Lamar Advertising (LAMR) has the cleanest history having operated under the Lamar name since its founding in 1902.8 Famously, the company was started by J.M. Coe and Charles W. Lamar, Sr. as a side-business to promote their larger Opera House business in Pensacola, FL. When the two partners decided to split in 1908, they flipped a coin to decide who gets what. Coe got the “better” opera house business while Lamar was left with the advertising business.9 The Pensacola Opera House ended up getting destroyed by a Hurricane in 1917 so Coe really wasn’t so lucky with that coin toss. Despite starting with simple posters, Lamar was quick to see the immense impact that the automobile was having on American society and expanded into roadside advertising. In 1926, Lamar and his two sons, Charles Lamar, Jr and L.V. Lamar, both of whom had joined their father in the business, acquired the Baton Rouge Poster Advertising Co. In the 1930s, the company purchased five more outdoor advertising companies in Louisiana and Florida. The company continued to grow via acquisition under president and CEO Kevin Reilly, Sr. who had married Charles Lamar, Sr.’s granddaughter. Reilly Sr. acquired eight more companies in Florida, Alabama, and Louisiana.10 The company continued to expand and diversify within the OOH sector through the ‘80s and ‘90s. In 1988, LAMR won a contract from the State of Nebraska to make interstate logo signs, which it grew into the largest provider of logo signs in the U.S. During this time, the company also expanded further into transit advertising. LAMR went public in 1996.
Business Model & Financials
Outdoor advertisers make money by leasing out space for advertising on billboards and other structures like buses, shelters, benches, logo plates, and airport terminals. Advertising contracts can be on a single billboard or a number of billboards for a large campaign. There are also cases where advertisers rent billboards under a rotary plan where the copy circulates from bulletin in one location to another within a market, usually every 60 to 90 days, to achieve greater reach. There are a number of different structural formats offered by the OOH advertisers. The figure below provides an overview of the display offerings using the terminology presented in LAMR’s 10-K but they are similar across the board. The majority of the business for each of the large three publicly traded OOH advertisers reside with Billboards, for which there are two types: the large bulletins and the smaller posters. All three have some Transit business, notably CCO’s Airport division, which they break out and OUT's MTA contract in NY, which they speak to. The logo signs business is only really significant for LAMR, who is the largest provider of logo sign services in the U.S.11

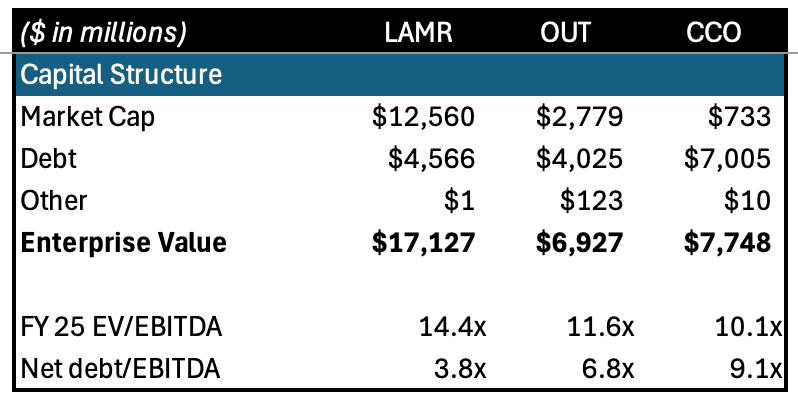
Of the top three firms, LAMR trades at a premium and appears to be investors’ favorite quality pick amongst the three. OUT and CCO are similar in enterprise value but CCO is notably leveraged at >9x net debt/EBITDA given it came out of the iHeartMedia bankruptcy.
In terms of the revenue breakdown, we can see from the figure below that the vast majority of the revenues come from the U.S. The exception is CCO with 1/3 of revenues from international; this is predominantly Northern Europe and the Other segment, which houses its business in Latin America and Asia. Recall CCO’s predecessor’s acquisition of The More Group in 1998 brought along significant international exposure to the business. In an effort to streamline and de-lever itself, CCO is in the process of selling off its non-US businesses. Additionally, in just the last quarter, OUT sold its Canadian business. As such, we’ll focus this section of the post on just the U.S. business unless stated otherwise.

From the same figure we can see that the revenue breakdown by national vs local advertising is similar for OUT and COO at ~60/40 national/local but LAMR is much more heavily weighted towards local at nearly 80% of the business in that cateogry. Similar to other mediums, local advertising is typically less cyclical than national advertising. It appears that LAMR has purposefully targeted developing its local market exposure by running a decentralized management structure and allowing local managers to run day-to-day operations in each local market. As such, the expertise of regional account executives is vital to winning wallet share in the local markets by providing tailored sales and service. It makes sense that an experienced local employee will know both the local area and the local business the best. LAMR proudly advertises that their regional managers have an average tenure of 32 years with the company. That’s bonkers. This is also pretty consistent with LAMR having a 4.4 rating on Glassdoor and winning multiple awards for work culture.
In terms of total displays, the figure below breaks out billboards by static and digital along with transit and other types of displays. You’ll notice that the average yields ($ revenue per display per month) vary quite a bit between the different players.
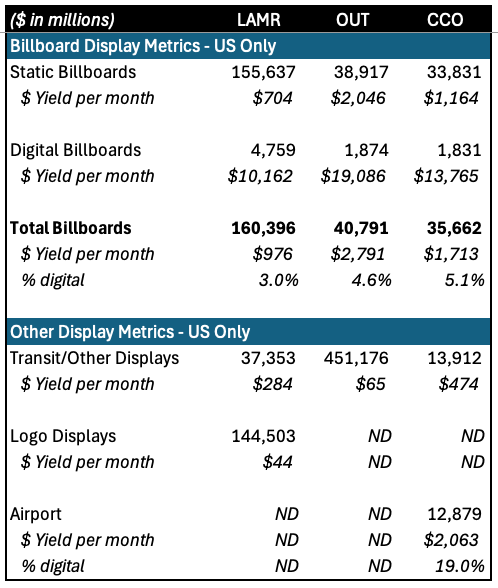
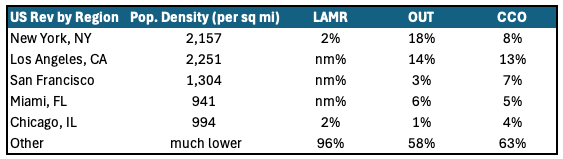
Yield is a function of the occupancy of the structure times the rate charged. The occupancy is effectively how many days in a period the structure has an advertiser utilizing it. Average occupancy is similar across the firms so that doesn’t contribute to the variation in yield. However, the average rate differs significantly by each player based on the location and type of the structures. Rate is impacted by a host of factors related to the quality of the billboard including how far it is from the road, the size, whether there are lights to illuminate the billboard, which side of the road it is on, etc. The biggest factor however is simply traffic or how many views (i.e. impressions) the ad gets. The more traffic a bulletin or poster gets the greater the rate it can charge. The figure below shows that OUT has the most revenue exposure to densely populated metropolitan areas like NYC and LA, followed by CCO while LAMR barely exists in those locations. This explains the majority of the delta between the yields.
There is also a significant delta in yield between digital and static billboards. Digital billboards are large LED displays that rotates ads every 6 to 8 seconds. Digital billboards expand the type of advertising feasible for billboards such as shorter duration campaigns that previously didn’t make sense for static displays. Comparing the digital display yields to static display yields suggest that the digital displays command a revenue >10x that of static displays. However, this is somewhat skewed by the fact that not all properties can be converted from static to digital and that it is likely that the first ones to be converted are in the best locations - this would bias the digital yield up at the same time biasing the static yield lower. In other words, I would not assume that converting a billboard from static to digital would more than 10x the revenue in all locations on a like-for-like basis. Management has spoken to something closer a 4-6x magnitude and a bit higher for EBITDA.
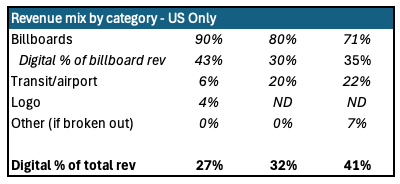
To understand the operating differences between the firms, we have to understand the mix differentials. 90% of LAMR’s revenues are accounted for by the core billboard business while underweighting transit. Its logo business is also small but it is a steady business with slightly higher than average margins; not surprising given the long-term nature of these contracts and the low maintenance of highway logo signs. OUT is more weighted towards transit, which is a bit of a lower margin business and it has spent a while trying to turn around its MTA contract, which is ~50% of the transit business and was free cash flow negative in 2023 due to contractual payments to the MTA and onerous capex requirements. CCO has a large Airport business which is ~20% of total U.S. revenues and was hit hard during COVID but has since seen a recovery as travel bounced back.
While the outdoor advertisers own the structures themselves and rent those out, they may not necessarily own the land underneath, which management calls “owning the underlying dirt”. Where the OOH firm doesn’t own the land, they pay a site lease expense, which is included in Direct Expenses in the income statement (LAMR calls this Direct Advertising Expenses). See the figure below for a snapshot of the income statement across the big three. Note that this figure is the full income statement and therefore includes the international businesses as well, which is most meaningful for CCO.

The bridge from operating income to Adj. EBITDA is pretty straight forward, adding back SBC, D&A, and some minor items. For OUT, the main call out is a ~$535M impairment charge in 2023, fair enough. For CCO however, they also adjust out a large chunk of corporate expenses that I don’t think is quite fair so I add it back in excluding SBC expense (labelled Barn Owl Adj. EBITDA) so that the metrics are comparable across the firms here. Another side note is that OUT calls it OIBDA. I know a lot of media companies use OIBDA instead of EBITDA but if anyone can articulate a difference, please let me know because I really can’t figure it out. The internet tells me that OIBDA starts from operating income and adjusts to OIBDA while EBITDA starts with net income and adjusts from there but I’m not sure that makes it different because you can go from operating income to EBITDA if you wanted to…like I did above. Anyways, back to the income statement, you’ll see that LAMR commands a much higher EBITDA margin than peers while OUT and CCO are somewhat similar. CCO’s international business drags down margins a bit so I’ve broken out just the CCO US business (i.e. Americas + Airports) for comparison and made some assumption on how to allocate the corporate expenses that I’m adding back into the EBITDA calculations.

On a like-for-like EBITDA basis, the majority of the margin delta between the firms is attributable to gross margin (i.e. revenue minus direct expenses) whereas SG&A/revenue is in the low 20% for all three. LAMR has the best gross margin of 67% with meaningfully lower site lease expense on both an absolute basis and margin percentage basis. On an absolute basis, the previously discussed geographic location being biased towards smaller (and therefore cheaper) regions partly explains it. On a margin basis, the meaningfully lower 16% vs OUT’s 28% and CCO US’s 38% is likely due to LAMR owning the dirt for ~20% of total revenues. OUT and CCO don’t breakout ownership but mention that they typically lease the sites instead of owning so I imagine this contributes to LAMR’s higher gross margins. Additionally, OUT’s transit business is lower gross margin with transit franchise expenses (part of Direct Expenses) being ~71% of transit display revenues, implying gross margins of ~29% before even considering the cost of posting and maintenance. LAMR has a lower transit exposure at ~6% of total U.S. revenues vs OUT’s ~20%, which explains a portion of the better margins at LAMR. CCO’s margin profile is also dragged down slightly by its Airport segment, which accounted for 22% of total U.S. revenues in 2023 but fielded (Barn Owl Adj.) EBITDA margins of 16% when burdened with a proportional amount of corporate expenses that the company doesn’t include in EBITDA. The business in 2023 was still seeing decent amounts of rent abatement benefits so the real margins there would be a few percentage points lower longer term. Net-net, the margin profile of the firms reflect a combination of business mix between billboard/transit/airport, ownership vs leasing of site grounds, and a few hundred bps of better execution at LAMR as evidenced by SG&A margins.
LAMR has been acquisitive, spending on average $300M per year in acquisitions (net of disposals) over the last 10 years. Assuming a purchase multiple of 12x EV/EBITDA and ~40% EBITDA margins, that’s roughly $600M in acquired run-rate revenues. OUT has done roughly a third of that over the same period while CCO has been a net seller of assets, notably selling the advertising rights in five major U.S. markets to LAMR in 2016 for $460M.
Investment Topics
Overall Industry Trends
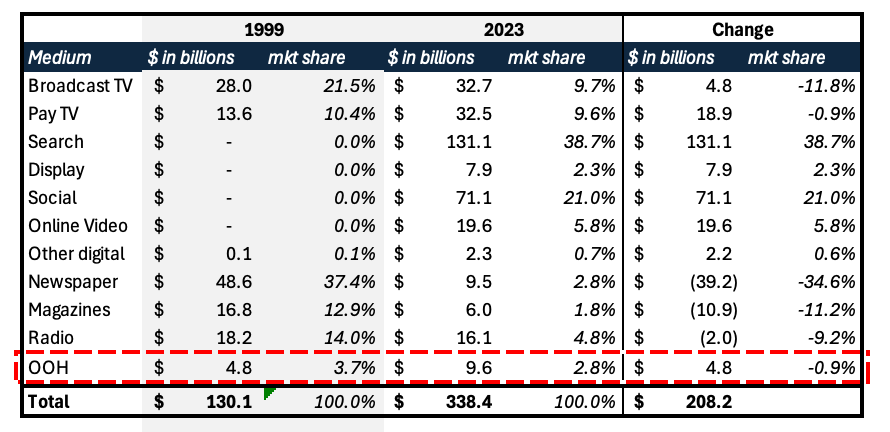
As legacy media continues to lose share to digital formats, the question of OOH’s LT sustainability is a natural one, but as we explored earlier, this format has been resilient through the business cycles and have grown with total advertising spend in the U.S. See table below for market share trends by medium since 1999. Over the last quarter century, OOH has maintained 3-4% market share rather consistently.

COVID accelerated digital formats across the board, resulting in OOH market share declining to under 3.0% for the first time and industry forecasts expect OOH to stay in that area over the medium term. Despite this decline, I would argue the resilience of this category is rather impressive. All “legacy” mediums have lost significant market share over the last quarter decade with print (newspaper + magazine) and radio having declined in absolute dollar terms as well. On the other hand, OOH has more than doubled its market size during the same time and added as much dollars as Broadcast TV despite being 5x smaller in 1999.
“Our local business is so strong that we are undoubtedly taking share from TV. Who watches the local TV news anymore? - Lamar CEO Sean Reilly taking a dig at TV advertising.

Compared to other forms of advertising, outdoor advertising CPMs continue to be low, ranging from $3 to $6 compared to broadcast TV in the $16 to $45 range. As digital billboards proliferate and measurement/programmatic capabilities improve, ROI for OOH advertising should also improve.
The downside case would argue that the industry will continue to lose share as COVID has permanently changed consumer and therefore advertiser behavior against travel and other outdoor activities (more work-from-home = less commute). The upside case would argue the opposite, namely that COVID was a 1x event and that the industry will recover back to ~4% market share and expand as digital mix improves. Overall, I think its reasonable to take the middle ground and assume that OOH will continue to grow with the overall advertising industry and remain ~3% market share over the medium term.
Digital Out-of-Home
A key growth driver of the OOH industry is the transition from static billboards to digital billboards. Digital out-of-home, also known as DOOH, drive both faster revenue growth as well as higher margins. DOOH revenues have grown at a 11% CAGR over the last decade and industry projections suggests that it will continue this pace through 2030, accelerating overall industry growth. Digital billboards are favorable because 1) it allows more advertisers to access the outdoor category, particularly those who wish to advertise for shorter periods of time, 2) it cycles through ads every 6 to 8 seconds, allowing for greater inventory across a greater number of advertisers, 3) advertisers are willing to pay a premium for digital given the greater flexibility and customizability across location and time of day for their ads. There are also programmatic capabilities as billboards move to digital as these firms can take unsold digital display inventory and connect with programmatic partners - this is still a small portion of the overall business but represents a growth opportunity as it gains traction.
Management of the OOH players have spoken to a 4-6x revenue uplift when a static billboard is converted to digital. As mentioned previously, the yields on current digital displays are more than 10x that of the static billboards but that’s likely due to the firms having converted the most favorable locations first. Related to that, we would also need to contemplate some upfront cannibalization when displays are first convert for the same reason. Incremental margins are in the 75% to 85% range for a typical conversion. The upfront capex is a bit over $200,00012 to convert a typical 14x48 display and opex nets out to lower than a static billboard because you don’t need a truck and many man-hours to put up and take down new advertising print. Yes, you need to connect and pay for electricity to power the LED display but that compares to static boards requiring illumination during the evening as well for static.
CCO was an early adopter of digital conversion, which is why it has a higher digital revenue mix at ~40% vs LAMR and OUT at ~30% each. LAMR breaks out the number of digital billboards and revenues from those billboards but I couldn’t find digital metrics for its transit displays but since LAMR’s mix of transit is small, I’ll ignore those for now. LAMR penetration of digital billboards has grown from ~1.6% in 2015 to 3.0% in 2023, adding on average 309 digital billboards per year. The mix of digital billboard revenues have grown from 19% in 2015 to nearly 30% in 2023. OUT’s pace of digital conversion has been slightly faster, growing digital billboard display penetration from 1.3% in 2015 to 4.6% in 2023 but given its smaller size, that amounts to ~159 new digital billboards per year. However as a percentage of total displays, the move has been more dramatic, going from 0.3% penetration in 2015 to 4.8% in 2023. This is driven by the transit business starting off with just 488 digital displays in 2015 to having nearly 22k digital displays in 2023 or adding more than 2,600 new digital displays per year in that business. CCO’s U.S. business has changed disclosures a few times and it was hard to find consistent historical data but based on the last two years we can see that CCO has the greatest percentage of digital displays at 7.8% driven primarily by its Airport division which has a 19% digital penetration of displays and 60% digital penetration of revenue. Not all displays can be converted into digital. Individual states may have regulations that restrict or prohibit digital displays. Imagine how annoying (and unsafe) would it be if all the billboards on a freeway were digital and played short-form ads all the time.

The figure above shows the NTM EV/EBITDA multiple for the three firms over the last 20 years. LAMR has mostly traded at a premium vs peers, likely given its history of strong and clean execution.

LAMR’s superior positioning is even more pronounced when viewed from a stock performance perspective. Since 2005, shares of LAMR has returned nearly +370% while OUT + 16% and CCO (-70%). Granted, LAMR’s +8.6% annual compounded rate is still behind SPX’s +10.4% during this time.
Trends for Reference


Wrapping it up…
The main growth driver in the sector is digital conversions and each of the top three seem to have thoroughly embraced it across business lines. Incremental share gains and losses within the sector are primarily driven by mix differentials and that seems to be the way investors trade the sector. The national vs local split drives medium-term outperformance and underperformance with the narrative in the 2018-2020 period being favorable to national exposure as national advertisers continue to shift share of wallet towards the OOH format, thus favoring OUT. More recently with the sluggish macro environment since 2022, national advertising has underperformed while local has remains steady, favoring LAMR. Investors will sometimes point to LAMR’s more favorable business mix (less transit) and consistent culture of execution but you’ll need to pay the premium for that. It’s clear that LAMR is the cleanest of the bunch on many fronts, even the paragraph earlier on its history felt easier to digest than the others. CCO is the only one with a real catalyst given its significant leverage and the opportunity to de-lever by selling non-core assets. Legion Partners has engaged with CCO over the last few years to encourage it in that direction including an open letter suggesting $3.57/share in fair value based on a SOTP analysis, ultimately putting their own representative on the board of the company.13
My impression of the industry is that it is quite similar to the local TV Broadcasters in that the industry’s barrier to entry is held up by historical regulatory developments and over time have fought the rise of digital advertising taking market share. There is some element of musical chairs as the businesses are predominately local stations/structures that get acquired and divested (albeit more so at the broadcasters than the outdoor advertisers). OOH feels like a better business given 1) its steadier end market and 2) less onerous ongoing regulations, allowing for a firm like LAMR to execute on a rollup strategy. This is reflected in the broadcasters trading at MSD-HSD EBITDA multiples while OOH trades at LDD multiples.
There are many estimates for total advertising spend with some pointing to $500B and more. I think many of these estimates include creative spend and other costs associated with marketing spend, which I’m not including since the OOH players (and most advertising platforms) don’t offer those services. The metrics I’m quoting here are from MAGNA.
https://www.magnaglobal.com/wp-content/uploads/2017/08/OutdoorOutlook_081517-.pdf
https://oaaa.org/resources/history-of-ooh/
https://www.billboardsin.com/who-prints-billboards
https://vectormedia.com/evolution-of-outdoor-advertising
https://www.womenshistory.org/articles/gardening-clubs
https://www.telcomhistory.org/resources/online-exhibits/telephone-company-histories/international-telephone-telegraph-corporation/
This is according to LAMR’s 10-K but I’ve seen other sources that say the company was originally called Pensacola Advertising Co. when it started in 1902 and renamed Lamar Advertising in 1908. Either way, it’s still effectively the same entity and the cleanest history.
https://www.referenceforbusiness.com/history/Ja-Lo/Lamar-Advertising-Company.html
LAMR has effectively been a family-run business with Kevin Reilly, Jr. joining the company in 1978 right after completing his undergraduate studies and rising through the ranks to become President and CEO by 1989. A brother, Wendell Reilly, served as CFO from 1985 to 1989. Another brother, Sean Reilly, worked as VP of M&A. Charles Lamar III was the company’s first GC, serving from 1982 to 1998.
The business goes by the name of Interstate Logos LLC
The capex should decrease overtime as LEDs are deflationary
https://www.prnewswire.com/news-releases/clear-channel-outdoor-holdings-inc-appoints-ted-white-to-board-of-directors-302050074.html
Great piece. It has a lot of similarities with the waste management industry in the lack of organic significant growth and how much they grow and expand their territories through acquisitions with occasional catalysts driven by technology advancements (digital billboards / recycling).